人工智能学习
描述性、诊断性、预测性和规范性数据分析的全面概述以及……
介绍
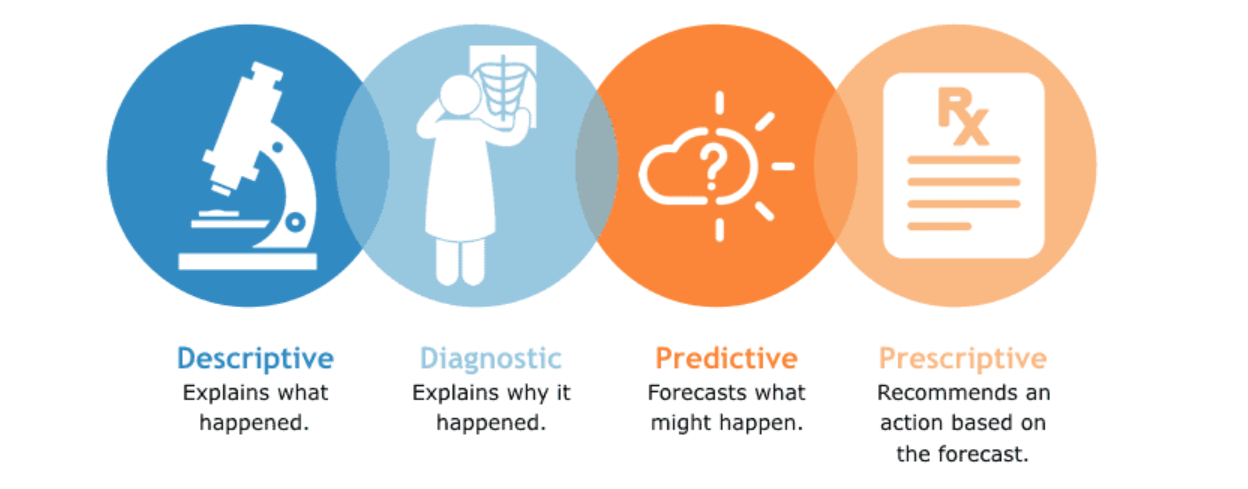
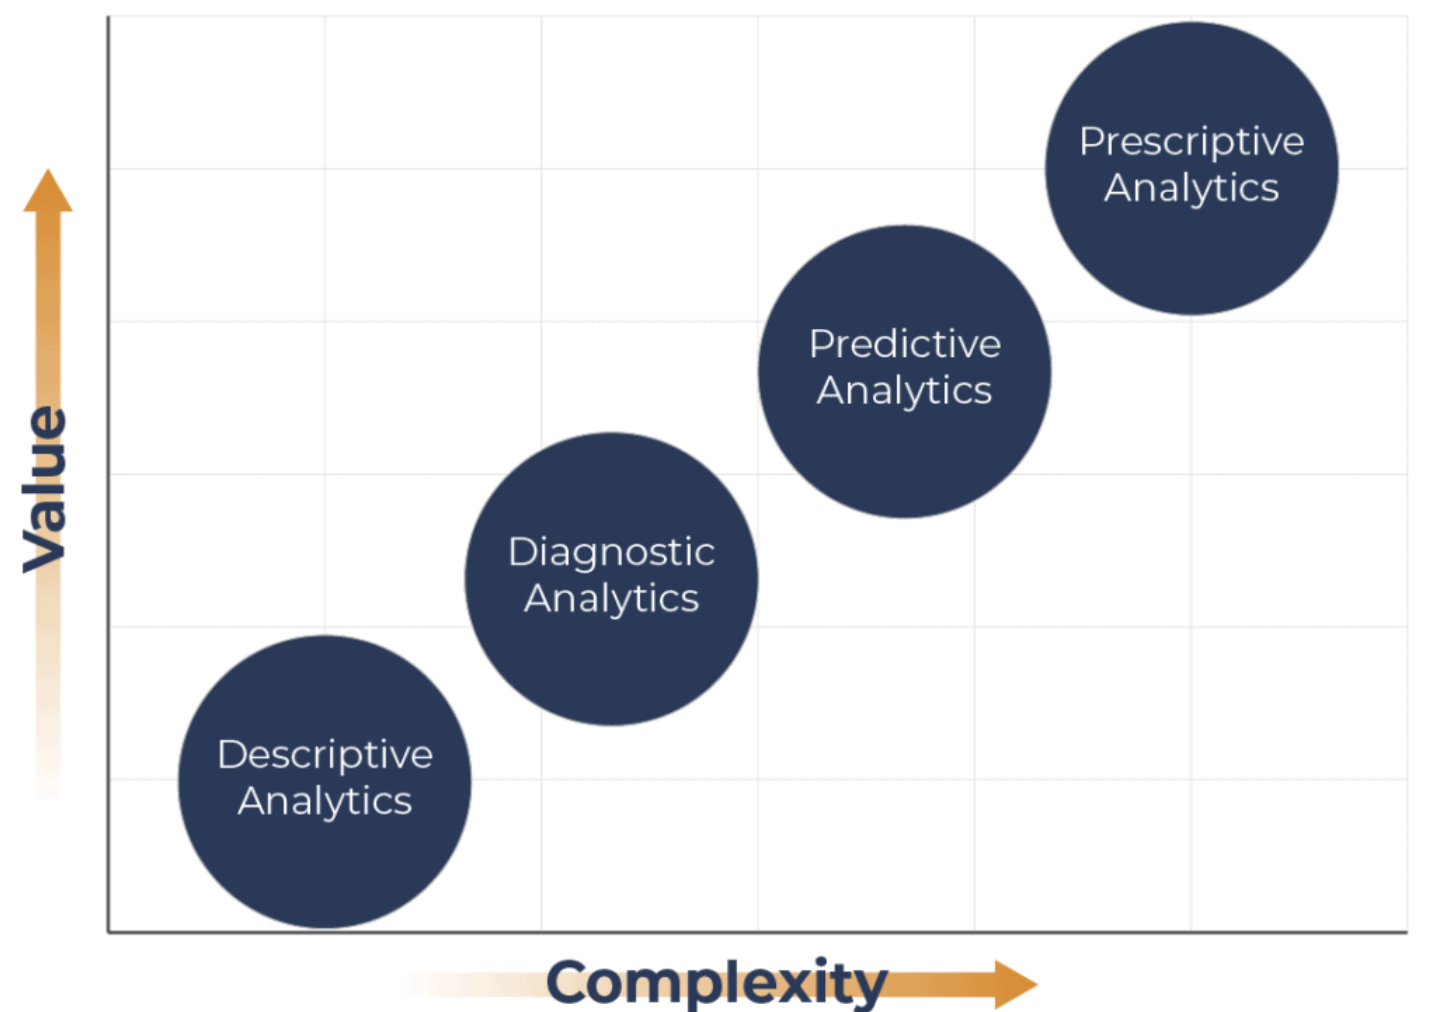
在数据科学和人工智能的快速发展中,采用了各种技术从数据中提取有价值的见解。数据分析和机器学习大致可分为四种主要类型:描述性、诊断性、预测性和规范性。这些方法中的每一种都有其独特的目的,并在各个领域的决策和解决问题中发挥着至关重要的作用。在本文中,我们将详细探讨这四种类型,重点介绍它们的主要特征、应用和在利用数据力量方面的重要性。
1. 描述性数据分析
描述性数据分析涉及以有意义的方式汇总和呈现数据,以概述其特征和模式。它主要侧重于理解过去和现在,而不对未来做出任何预测。描述性分析技术包括平均值、中位数、模式和标准差等统计度量,以及直方图、条形图和散点图等数据可视化方法。
应用:描述性数据分析通常用于市场研究、商业智能和数据报告。它可以帮助企业了解客户行为、跟踪销售业绩并深入了解其运营的整体健康状况。
2. 诊断数据分析
诊断数据分析旨在确定数据中观察到的某些模式或事件背后的原因。它试图回答“为什么”的问题并理解变量之间的因果关系。这种类型的分析涉及进行深入的调查和统计测试,以发现影响观察到的结果的潜在因素。
应用:诊断分析在医疗保健等领域至关重要,用于识别疾病的根本原因,或在质量控制过程中识别导致制造缺陷的问题。
3. 预测数据分析
预测数据分析使用历史数据和统计算法对未来事件或结果做出明智的预测。它涉及构建预测模型,这些模型可以根据历史数据进行训练,然后用于预测未来的趋势或行为。预测的准确性取决于数据的质量和所选机器学习算法的适用性。
应用:预测分析可在不同领域找到应用,包括金融(信用风险评估)、营销(客户流失预测)和天气预报,有助于根据预期结果做出主动决策。
4. 规范性数据分析和机器学习
规范性数据分析不仅仅是预测未来事件;它提出了实现预期结果的最佳行动方案。它使用先进的机器学习技术来模拟场景,并根据预定义的目标和约束确定最佳行动方案。
应用:规范性分析广泛用于供应链管理、资源优化和个性化医疗。例如,它可以为物流公司推荐最有效的配送路线,或者根据患者的病史和遗传信息为患者提出个性化的治疗方案。
法典
为了演示使用 Python 进行描述性、诊断性、预测性和规范性数据分析的概念,我将为每种类型的分析提供代码片段。我们将使用学生考试成绩的假设数据集进行说明。
描述性数据分析
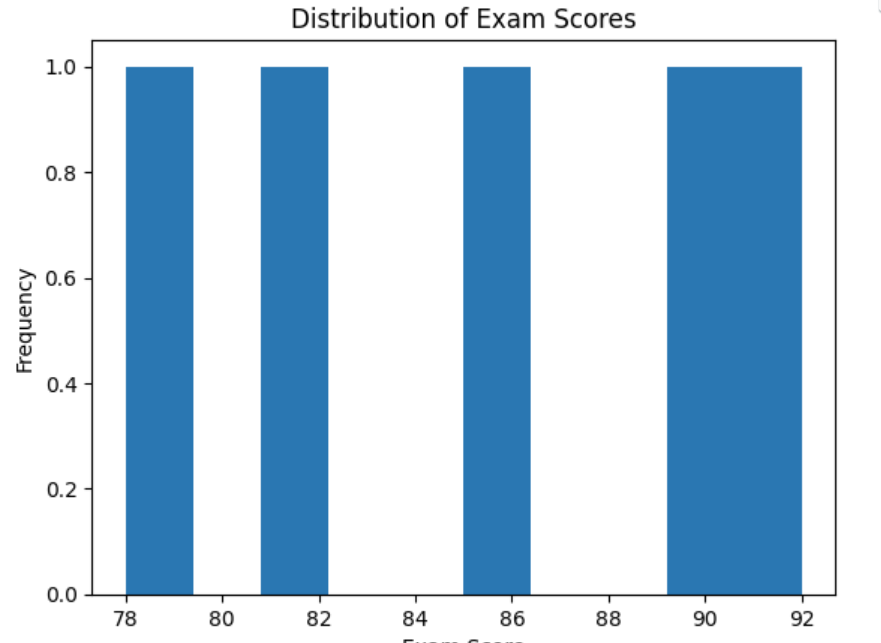
描述性分析旨在汇总和可视化数据,以深入了解其特征。我们将计算基本统计度量并创建可视化效果。
import pandas as pd
import matplotlib.pyplot as plt

# Hypothetical dataset of student exam scores
data = {'StudentID': [1, 2, 3, 4, 5],
        'ExamScore': [85, 78, 90, 82, 92]}
df = pd.DataFrame(data)

# Calculate mean and standard deviation
mean_score = df['ExamScore'].mean()
std_dev = df['ExamScore'].std()

print("Mean Exam Score:", mean_score)
print("Standard Deviation:", std_dev)

# Create a histogram to visualize the distribution of scores
plt.hist(df['ExamScore'], bins=10)
plt.title("Distribution of Exam Scores")
plt.xlabel("Exam Score")
plt.ylabel("Frequency")
plt.show()
诊断数据分析
诊断分析旨在了解观察到的模式背后的原因。我们将执行相关性分析以查找变量之间的关系。
import pandas as pd

# Hypothetical dataset of student exam scores and study hours
data = {'StudentID': [1, 2, 3, 4, 5],
        'ExamScore': [85, 78, 90, 82, 92],
        'StudyHours': [4, 3, 5, 3, 6]}
df = pd.DataFrame(data)

# Calculate correlation between exam scores and study hours
correlation = df['ExamScore'].corr(df['StudyHours'])
print("Correlation between Exam Scores and Study Hours:", correlation)
Correlation between Exam Scores and Study Hours: 0.9575129564099746
预测数据分析
预测分析旨在对未来结果进行预测。我们将使用简单的线性回归模型来根据学习时间预测考试成绩。
import pandas as pd
from sklearn.linear_model import LinearRegression

# Hypothetical dataset of student exam scores and study hours
data = {'StudentID': [1, 2, 3, 4, 5],
        'ExamScore': [85, 78, 90, 82, 92],
        'StudyHours': [4, 3, 5, 3, 6]}
df = pd.DataFrame(data)

# Prepare data for modeling
X = df[['StudyHours']]
y = df['ExamScore']

# Create and train a linear regression model
model = LinearRegression()
model.fit(X, y)

# Predict exam scores for new study hours
new_study_hours = [7, 8, 9]
predicted_scores = model.predict(pd.DataFrame(new_study_hours, columns=['StudyHours']))

print("Predicted Exam Scores for New Study Hours:")
for i in range(len(new_study_hours)):
    print(f"Study Hours: {new_study_hours[i]}, Predicted Score: {predicted_scores[i]}")
Predicted Exam Scores for New Study Hours:
Study Hours: 7, Predicted Score: 97.17647058823529
Study Hours: 8, Predicted Score: 101.38235294117646
Study Hours: 9, Predicted Score: 105.58823529411765
规范性数据分析
规范性分析根据预定义的目标和约束推荐最佳行动方案。我们将使用一个简单的优化问题来找到最高考试分数,同时考虑学习时间限制。
import pandas as pd
from scipy.optimize import minimize

# Hypothetical dataset of student exam scores and study hours
data = {'StudentID': [1, 2, 3, 4, 5],
        'ExamScore': [85, 78, 90, 82, 92],
        'StudyHours': [4, 3, 5, 3, 6]}
df = pd.DataFrame(data)

# Define the objective function to maximize exam scores
def objective_function(x):
    return -(df['ExamScore'] * x).sum()

# Define the constraint function for study hours (total study hours <= 20)
def constraint_function(x):
    return 20 - (df['StudyHours'] * x).sum()

# Initial guess for the optimization
x0 = [1, 1, 1, 1, 1]

# Define the constraints
constraint = {'type': 'ineq', 'fun': constraint_function}

# Perform optimization
result = minimize(objective_function, x0, constraints=constraint)

# Extract the optimal study hour allocation
optimal_study_hours = result.x

print("Optimal Study Hour Allocation:")
for i, student_id in enumerate(df['StudentID']):
    print(f"Student {student_id}: {optimal_study_hours[i]} hours")
Optimal Study Hour Allocation:
Student 1: -4.4565814352035854e+24 hours
Student 2: -5.0932735987608005e+28 hours
Student 3: -6.576581741048669e+29 hours
Student 4: 1.0960680991161268e+30 hours
Student 5: -3.7006777519270405e+24 hours
注意:提供的代码片段仅用于演示目的,可能不代表实际场景。在实际应用中,您需要仔细处理数据预处理、模型选择和性能评估。此外,此处使用的数据集很小且是虚构的;现实世界的数据集可能需要更复杂的技术和模型来进行分析和预测。
结论
总之,描述性、诊断性、预测性和规范性数据分析以及机器学习技术是数据驱动决策过程中必不可少的工具。每种类型的分析都有不同的目的,并提供对数据不同方面的独特见解。描述性分析有助于理解历史趋势,诊断分析有助于确定观察到的模式的根本原因,预测分析预测未来事件,规范性分析建议最佳行动。随着数据科学和机器学习的不断发展,这些分析方法的集成将进一步使组织能够充分利用其数据的潜力并推动各个领域的创新。
-
实战:30 行代码做一个网页端的 AI 聊天助手11-20
-
5分钟搞懂大模型的重复惩罚后处理11-18
-
基于Ollama和pgai的个人知识助手项目:用Postgres和向量扩展打造智能数据库11-18
-
我用同一个提示测试了4款AI工具,看看谁设计的界面更棒11-15
-
深度学习面试的时候,如何回答1x1卷积的作用11-15
-
检索增强生成即服务:开发者的得力新帮手11-15
-
技术与传统:人工智能时代的最后一袭纱丽11-15
-
未结构化数据不仅仅是给嵌入用的:利用隐藏结构提升检索性能11-15
-
Emotion项目实战:新手入门教程11-15
-
7 个开源库助你构建增强检索生成(RAG)、代理和 AI 搜索11-15
-
Vertex AI上下文缓存与Gemini模型详解11-15
-
用可视化评估你的检索增强生成系统:RAG系统的评估与分析11-15
-
强化学习:教智能代理操作发电厂的方法11-15
-
质量工程师眼中的检索增强生成(RAG)解析11-15
-
让我们聊一聊算法和社会媒体那些事儿11-15


