区块链技术
Grafana 系列文章(十四):Helm 安装Loki

本文主要是介绍Grafana 系列文章(十四):Helm 安装Loki,对大家解决编程问题具有一定的参考价值,需要的程序猿们随着小编来一起学习吧!
前言
写或者翻译这么多篇 Loki 相关的文章了, 发现还没写怎么安装 😓
现在开始介绍如何使用 Helm 安装 Loki.
前提
有 Helm, 并且添加 Grafana 的官方源:
helm repo add grafana https://grafana.github.io/helm-charts
helm repo update
🐾Warning:
网络受限, 需要保证网络通畅.
部署
架构
Promtail(收集) + Loki(存储及处理) + Grafana(展示)
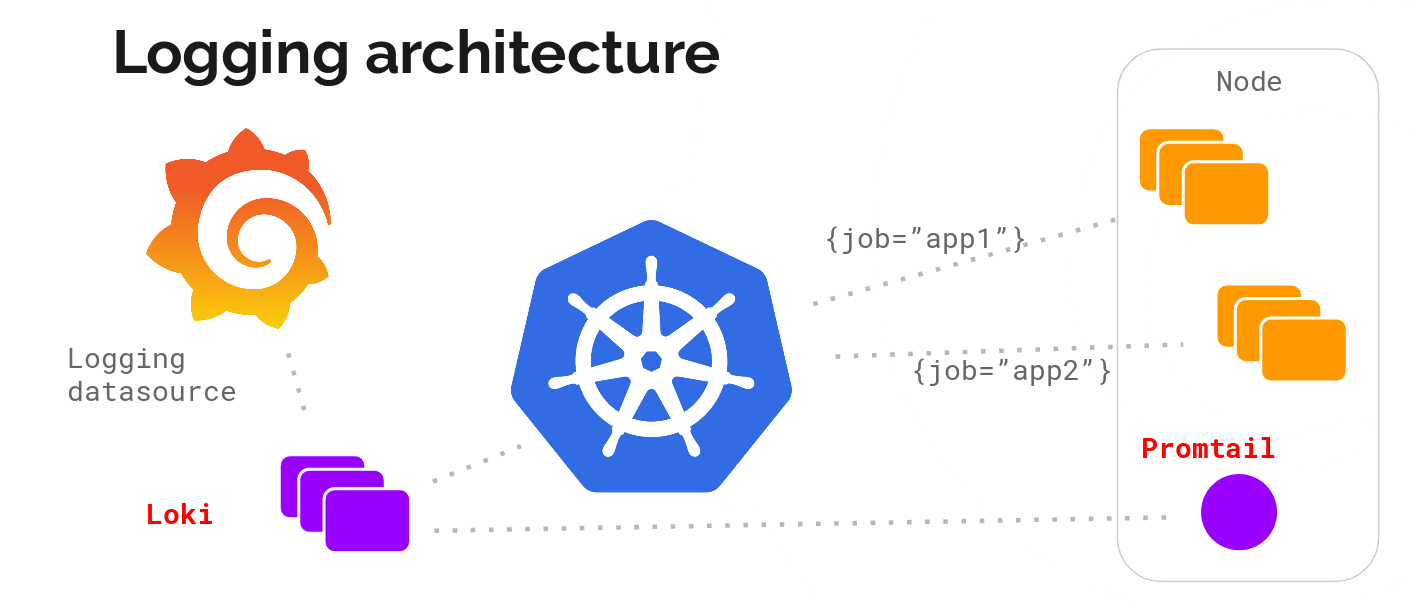
Promtail
- 启用 Prometheus Operator Service Monitor 做监控
- 增加
external_labels-cluster, 以识别是哪个 K8S 集群; pipeline_stages改为cri, 以对 cri 日志做处理(因为我的集群用的 Container Runtime 是 CRI, 而 Loki Helm 默认配置是docker)- 增加对
systemd-journal的日志收集:
promtail:
  config:
    snippets:
      pipelineStages:
        - cri: {}

  extraArgs:
    - -client.external-labels=cluster=ctyun
  # systemd-journal 额外配置:
  # Add additional scrape config
  extraScrapeConfigs:
    - job_name: journal
      journal:
        path: /var/log/journal
        max_age: 12h
        labels:
          job: systemd-journal
      relabel_configs:
        - source_labels: ['__journal__systemd_unit']
          target_label: 'unit'
        - source_labels: ['__journal__hostname']
          target_label: 'hostname'

  # Mount journal directory into Promtail pods
  extraVolumes:
    - name: journal
      hostPath:
        path: /var/log/journal

  extraVolumeMounts:
    - name: journal
      mountPath: /var/log/journal
      readOnly: true
Loki
- 启用持久化存储
- 启用 Prometheus Operator Service Monitor 做监控
- 并配置 Loki 相关 Prometheus Rule 做告警
- 因为个人集群日志量较小, 适当调大 ingester 相关配置
Grafana
- 启用持久化存储
- 启用 Prometheus Operator Service Monitor 做监控
- sidecar 都配置上, 方便动态更新 dashboards/datasources/plugins/notifiers;
Helm 安装
通过如下命令安装:
helm upgrade --install loki --namespace=loki --create-namespace grafana/loki-stack -f values.yaml
自定义 values.yaml 如下:
loki:
  enabled: true
  persistence:
    enabled: true
    storageClassName: local-path
    size: 20Gi
  serviceScheme: https
  user: admin
  password: changit!
  config:
    ingester:
      chunk_idle_period: 1h
      max_chunk_age: 4h
    compactor:
      retention_enabled: true
  serviceMonitor:
    enabled: true
    prometheusRule:
      enabled: true
      rules:
        #  Some examples from https://awesome-prometheus-alerts.grep.to/rules.html#loki
        - alert: LokiProcessTooManyRestarts
          expr: changes(process_start_time_seconds{job=~"loki"}[15m]) > 2
          for: 0m
          labels:
            severity: warning
          annotations:
            summary: Loki process too many restarts (instance {{ $labels.instance }})
            description: "A loki process had too many restarts (target {{ $labels.instance }})\n  VALUE = {{ $value }}\n  LABELS = {{ $labels }}"
        - alert: LokiRequestErrors
          expr: 100 * sum(rate(loki_request_duration_seconds_count{status_code=~"5.."}[1m])) by (namespace, job, route) / sum(rate(loki_request_duration_seconds_count[1m])) by (namespace, job, route) > 10
          for: 15m
          labels:
            severity: critical
          annotations:
            summary: Loki request errors (instance {{ $labels.instance }})
            description: "The {{ $labels.job }} and {{ $labels.route }} are experiencing errors\n  VALUE = {{ $value }}\n  LABELS = {{ $labels }}"
        - alert: LokiRequestPanic
          expr: sum(increase(loki_panic_total[10m])) by (namespace, job) > 0
          for: 5m
          labels:
            severity: critical
          annotations:
            summary: Loki request panic (instance {{ $labels.instance }})
            description: "The {{ $labels.job }} is experiencing {{ printf \"%.2f\" $value }}% increase of panics\n  VALUE = {{ $value }}\n  LABELS = {{ $labels }}"
        - alert: LokiRequestLatency
          expr: (histogram_quantile(0.99, sum(rate(loki_request_duration_seconds_bucket{route!~"(?i).*tail.*"}[5m])) by (le)))  > 1
          for: 5m
          labels:
            severity: critical
          annotations:
            summary: Loki request latency (instance {{ $labels.instance }})
            description: "The {{ $labels.job }} {{ $labels.route }} is experiencing {{ printf \"%.2f\" $value }}s 99th percentile latency\n  VALUE = {{ $value }}\n  LABELS = {{ $labels }}"

promtail:
  enabled: true
  config:
    snippets:
      pipelineStages:
        - cri: {}
  extraArgs:
    - -client.external-labels=cluster=ctyun
  serviceMonitor:
    # -- If enabled, ServiceMonitor resources for Prometheus Operator are created
    enabled: true

  # systemd-journal 额外配置:
  # Add additional scrape config
  extraScrapeConfigs:
    - job_name: journal
      journal:
        path: /var/log/journal
        max_age: 12h
        labels:
          job: systemd-journal
      relabel_configs:
        - source_labels: ['__journal__systemd_unit']
          target_label: 'unit'
        - source_labels: ['__journal__hostname']
          target_label: 'hostname'

  # Mount journal directory into Promtail pods
  extraVolumes:
    - name: journal
      hostPath:
        path: /var/log/journal

  extraVolumeMounts:
    - name: journal
      mountPath: /var/log/journal
      readOnly: true

fluent-bit:
  enabled: false

grafana:
  enabled: true
  adminUser: caseycui
  adminPassword: changit!
  ## Sidecars that collect the configmaps with specified label and stores the included files them into the respective folders
  ## Requires at least Grafana 5 to work and can't be used together with parameters dashboardProviders, datasources and dashboards
  sidecar:
    image:
      repository: quay.io/kiwigrid/k8s-sidecar
      tag: 1.15.6
      sha: ''
    dashboards:
      enabled: true
      SCProvider: true
      label: grafana_dashboard
    datasources:
      enabled: true
      # label that the configmaps with datasources are marked with
      label: grafana_datasource
    plugins:
      enabled: true
      # label that the configmaps with plugins are marked with
      label: grafana_plugin
    notifiers:
      enabled: true
      # label that the configmaps with notifiers are marked with
      label: grafana_notifier
  image:
    tag: 8.3.5
  persistence:
    enabled: true
    size: 2Gi
    storageClassName: local-path
  serviceMonitor:
    enabled: true
  imageRenderer:
    enabled: disable

filebeat:
  enabled: false

logstash:
  enabled: false
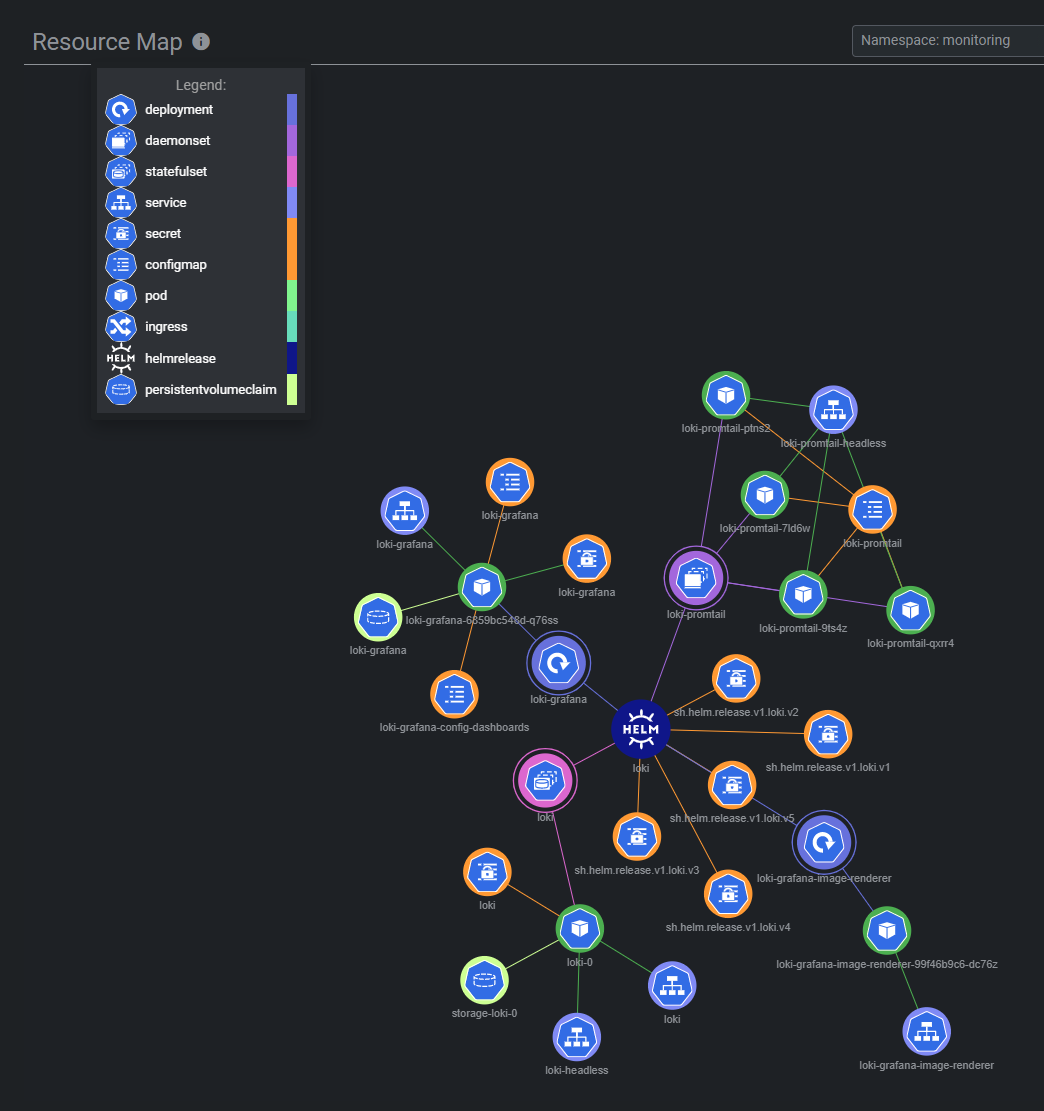
安装后的资源拓扑如下:
Day 2 配置(按需)
Grafana 增加 Dashboards
在同一个 NS 下, 创建如下 ConfigMap: (只要打上grafana_dashboard 这个 label 就会被 Grafana 的 sidecar 自动导入)
apiVersion: v1
kind: ConfigMap
metadata:
  name: sample-grafana-dashboard
  labels:
     grafana_dashboard: "1"
data:
  k8s-dashboard.json: |-
  [...]
Grafana 增加 DataSource
在同一个 NS 下, 创建如下 ConfigMap: (只要打上grafana_datasource 这个 label 就会被 Grafana 的 sidecar 自动导入)
apiVersion: v1
kind: ConfigMap
metadata:
  name: loki-loki-stack
  labels:
    grafana_datasource: '1'
data:
  loki-stack-datasource.yaml: |-
    apiVersion: 1
    datasources:
    - name: Loki
      type: loki
      access: proxy
      url: http://loki:3100
      version: 1
Traefik 配置 Grafana IngressRoute
因为我是用的 Traefik 2, 通过 CRD IngressRoute 配置 Ingress, 配置如下:
apiVersion: traefik.containo.us/v1alpha1
kind: IngressRoute
metadata:
  name: grafana
spec:
  entryPoints:
    - web
    - websecure
  routes:
    - kind: Rule
      match: Host(`grafana.ewhisper.cn`)
      middlewares:
        - name: hsts-header
          namespace: kube-system
        - name: redirectshttps
          namespace: kube-system
      services:
        - name: loki-grafana
          namespace: monitoring
          port: 80
  tls: {}
最终效果
如下:
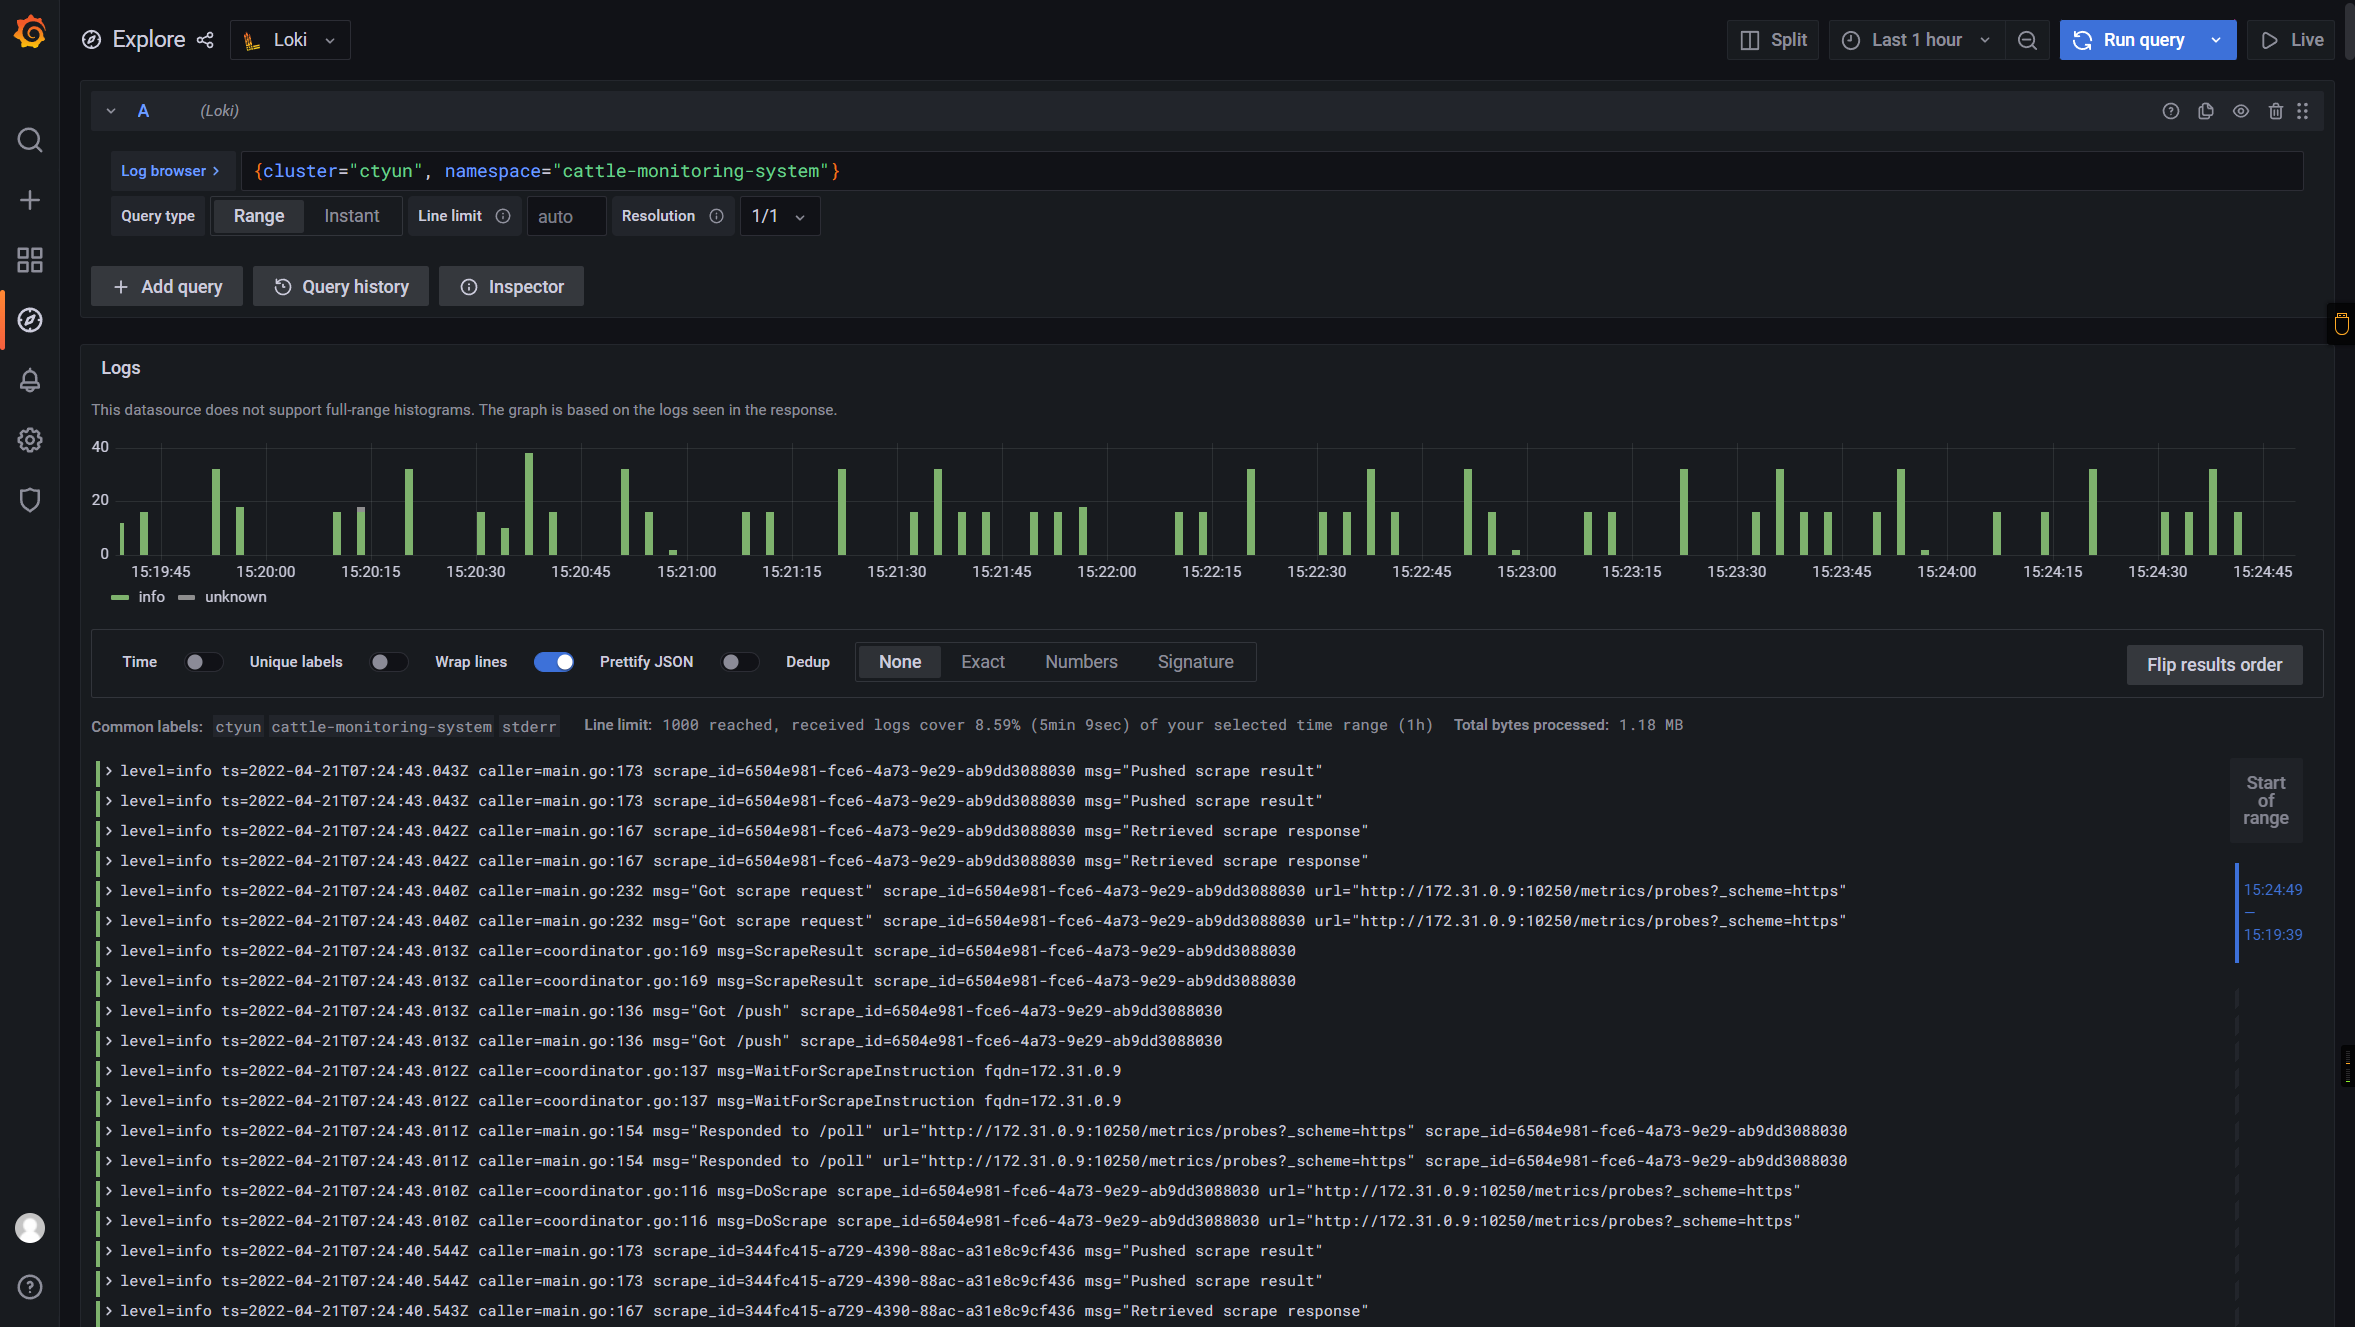
🎉🎉🎉
📚️参考文档
- helm-charts/charts at main · grafana/helm-charts (github.com)
Grafana 系列文章
Grafana 系列文章
三人行, 必有我师; 知识共享, 天下为公. 本文由东风微鸣技术博客 EWhisper.cn 编写.
这篇关于Grafana 系列文章(十四):Helm 安装Loki的文章就介绍到这儿,希望我们推荐的文章对大家有所帮助,也希望大家多多支持为之网!
您可能喜欢
-
Kubernetes生产环境问题排查指南:实战教程12-21
-
使用Encore.ts构建和部署TypeScript微服务到Kubernetes集群12-20
-
Kubernetes:从理念到1.0的历程12-20
-
第28天:Kubernetes中的蓝绿部署讲解12-18
-
从零到Kubernetes安全大师:简化集群安全防护12-15
-
掌握Kubernetes节点调度:污点、容忍、节点选择器和节点亲和性12-15
-
第五天:与容器互动12-14
-
CKA(Kubernetes管理员认证)速查表12-11
-
.NET Aspire应用部署到Azure和Kubernetes实战指南12-08
-
云原生周报:K8s未来三大发展方向不容错过12-07
-
《 Kubernetes开发者的书评:从入门到生产实战》12-07
-
Longhorn: Rancher 推出的 Kubernetes 云原生存储解决方案12-06
-
为Amazon EKSBlueprints for CDK项目贡献代码指南12-04
-
KubeShark:Kubernetes集群的网络流量监控神器,就像Wireshark一样好用!12-02
-
云原生周报:Knative 1.15版本发布啦!12-02
栏目导航
